effective_area#
- iris.sg.effective_area(time, wavelength)[source]#
Load the effective area of the spectrograph.
This function uses
irispy.utils.response.get_interpolated_effective_area()to find the effective area for a given time and wavelength.- Parameters:
time (Time | AbstractScalarArray) – The time at which to calculate the effective area. Must be only a single time, an array of times is not supported.
wavelength (Quantity | AbstractScalarArray) – The wavelength of the incident light at which to evaluate the effective area.
- Return type:
Examples
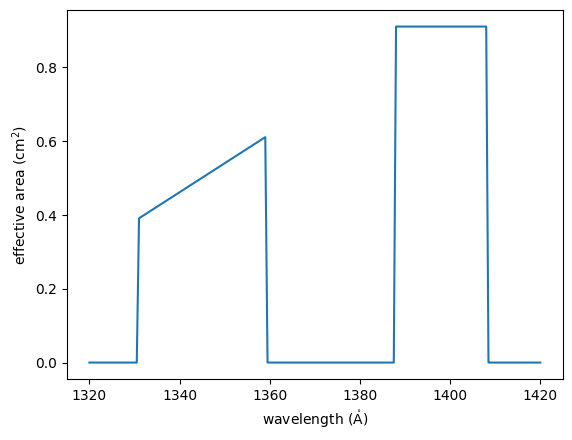
Reproduce Figure 22 of Wülser et al. [2018], the effective area of the FUV spectrograph channel on March 1st, 2015.
import matplotlib.pyplot as plt
import astropy.units as u
import astropy.time
import astropy.visualization
import named_arrays as na
import iris

# Define the time at which to evaluate the effective area
time = astropy.time.Time("2015-03-01")

# Define the wavelength grid
wavelength = na.linspace(
    start=1320 * u.AA,
    stop=1420 * u.AA,
    axis="wavelength",
    num=1001,
)

# Compute the effective area
area = iris.sg.effective_area(time, wavelength)

# Plot the effective area as a function of wavelength
with astropy.visualization.quantity_support():
    fig, ax = plt.subplots()
    na.plt.plot(
        wavelength,
        area,
    )
    ax.set_xlabel(f"wavelength ({ax.get_xlabel()})")
    ax.set_ylabel(f"effective area ({ax.get_ylabel()})")
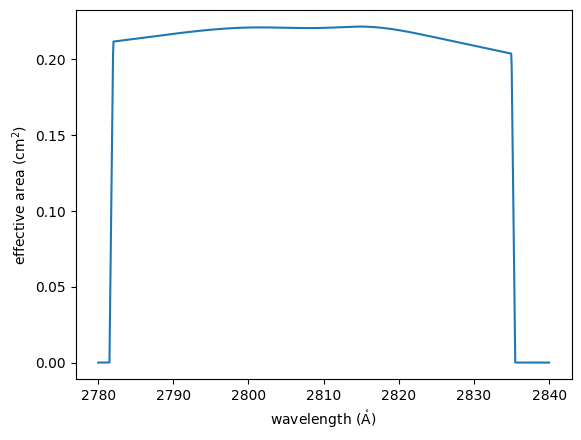
Reproduce Figure 23 of Wülser et al. [2018], the effective area of the NUV spectrograph channel on October 20th, 2014.
# Define the time at which to evaluate the effective area
time = astropy.time.Time("2014-10-20")

# Define a wavelength grid
wavelength = na.linspace(
    start=2780 * u.AA,
    stop=2840 * u.AA,
    axis="wavelength",
    num=1001,
)

# Compute the effective area
area = iris.sg.effective_area(time, wavelength)

# Plot the effective area as a function of wavelength
with astropy.visualization.quantity_support():
    fig, ax = plt.subplots()
    na.plt.plot(
        wavelength,
        area,
    )
    ax.set_xlabel(f"wavelength ({ax.get_xlabel()})")
    ax.set_ylabel(f"effective area ({ax.get_ylabel()})")