SpectrographObservation#
- class iris.sg.SpectrographObservation(inputs=0, outputs=0, timedelta=<Quantity 0. s>, axis_time='time', axis_wavelength='wavelength', axis_detector_x='detector_x', axis_detector_y='detector_y')[source]#
Bases:
FunctionArray[AbstractTemporalSpectralPositionalVectorArray,AbstractScalarArray]A sequence of observations captured by the IRIS spectrograph.
Examples
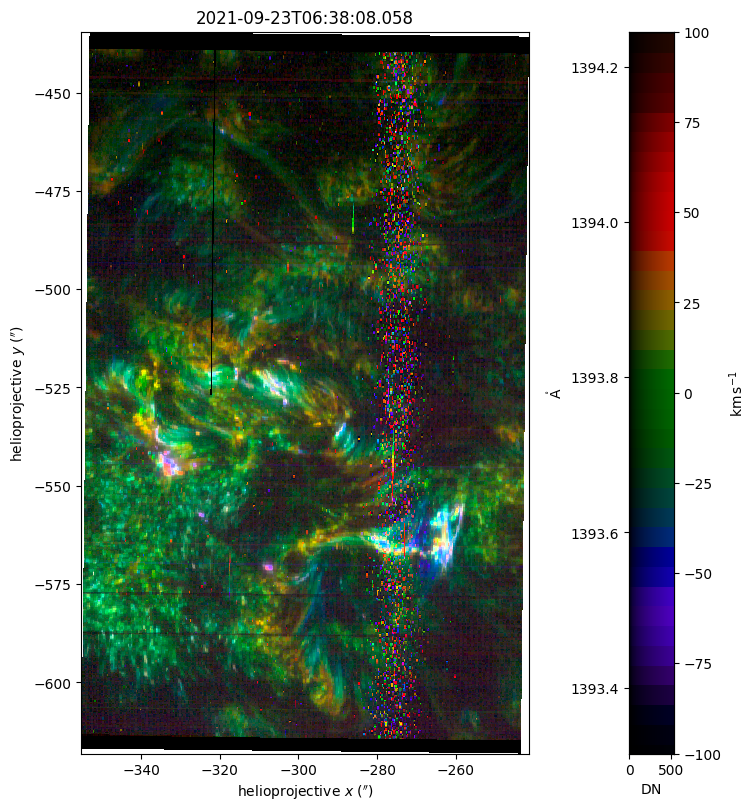
Load a IRIS raster and plot as an RGB image using the
named_arrays.colorsynthmodule.import iris # Load a 320-step raster obs = iris.sg.open("2021-09-23T06:13") # Display the first raster as a false-color image obs.show();
Attributes
A
tupleofstrrepresenting the names of each dimension of this array.Return keys corresponding to all input axes representing bin centers
Return keys corresponding to all input axes representing bin vertices
The logical axis corresponding to changes in detector \(x\)-coordinate.
The logical axis corresponding to changes in detector \(y\)-coordinate.
The logical axis corresponding to changes in time.
The logical axis corresponding to changes in wavelength.
if this array has multiple components, broadcast them against each other.
Converts this array to an instance of
named_arrays.AbstractExplicitArray.Compute the index of each element of this array.
The inputs of the function.
L2-norm of this array.
Number of dimensions of the array.
The outputs of the function.
Convert to radiometric units using
iris.sg.effective_area().The number of elements along each axis of the array.
Total number of elements in the array.
The exposure time for each frame in the observation.
The
named_arrays.AbstractArraytype corresponding to this array.The
named_arrays.AbstractExplicitArraytype corresponding to this array.Returns a new array with its units removed, if they exist.
Methods
__init__([inputs, outputs, timedelta, ...])add_axes(axes)Add new singleton axes to this array.
all([axis, where])Return
Trueif all of the elements along the given axes areTrue.any([axis, where])Return
Trueif any of the elements along the given axes areTrue.astype(dtype[, order, casting, subok, copy])Copy of the array cast to a specific data type.
broadcast_to(shape[, append])A new view of this array with the specified shape.
cell_centers([axis, random])Convert an array from cell vertices to cell centers.
combine_axes([axes, axis_new])Combine some of the axes of the array into a single new axis.
copy()Create a deep copy of this array.
Create a shallow copy of this array.
empty(shape_base, shape_wcs[, axis_time, ...])Create an empty SpectrographObservation object.
from_fits(path[, window, axis_time, ...])Given a single FITS file or an array of FITS files with the same OBSID, construct a SpectrographObservation object.
from_scalar_array(a[, like])Constructs a new version of this array using
aas the underlying data.from_time_range([time_start, time_stop, ...])Given an OBSID and a time range, automatically download the data and construct an instance of
SpectrographObservation.index(value[, axis])index_secant(value[, axis])integrate(axis[, component])Integrate the outputs over the given input
axisor axes.interp_linear(item)Linearly interpolate this array to find its value at the given fractional index.
isel(**item)Index this array along named axes given as keyword arguments.
max([axis, initial, where])The maximum value of this array along the given axes.
mean([axis, where])The mean value of this array along the given axes.
median([axis])The median value of this array along the given axes.
min([axis, initial, where])The minimum value of this array along the given axes.
ndindex([axis_ignored])An iterator that yields the index of each element of this array.
pcolormesh(axs, input_component_x, ...[, ...])Plot a
FunctionArrayviamatplotlib.pyplot.pcolormesh().percentile(q[, axis, out, overwrite_input, ...])The requested percentile of this array along the given axes.
ptp([axis])The peak-to-peak value of this array along the given axes.
regrid(inputs[, axis, method, weights])Resample this function array onto a new set of input coordinates using
named_arrays.regridding.regrid().replace(**changes)A method version of
dataclasses.replace()for named arrays.reshape(shape)Reorganize this array into a new shape.
rms([axis, where])The root-mean-square of this array along the given axes.
show([index_time, ax, cax, norm, vmin, ...])Display a single raster of this dataset as a false-color image.
std([axis, where])The standard deviation of this array along the given axes.
sum([axis, where])The sum of each element of this array along the given axes.
take_along_axis(indices, axis)Take values from this array by matching
indicesalongaxis.to(unit[, equivalencies, copy])Convert this array to a new unit.
to_jshtml([norm, vmin, vmax, velocity_min, ...])Create a Javascript animation of this observation.
to_string([prefix, multiline])Convert this array instance to a string representation.
to_string_array([format_value, format_unit, ...])Convert to an array of strings where each string has an appropriately-formatted unit attached to the value.
to_value(unit[, equivalencies])The numerical value of this array, possibly in a different unit.
transpose([axes])Reorder the axes of this array to the given sequence.
var([axis, where])The variance of this array along the given axes.
vmr([axis, where])The variance-to-mean ratio of this array along the given axes.
volume_cell(axis)Computes the n-dimensional volume of each cell formed by interpreting this array as a logically-rectangular grid of vertices.
weights(inputs[, axis, method])Compute the resampling weights of this array using
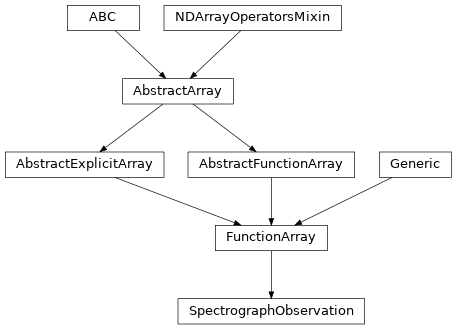
named_arrays.regridding.weights().Inheritance Diagram
- Parameters:
- classmethod empty(shape_base, shape_wcs, axis_time='time', axis_wavelength='wavelength', axis_detector_x='detector_x', axis_detector_y='detector_y')[source]#
Create an empty SpectrographObservation object.
- Parameters:
shape_base (dict[str, int]) – The shape of the result excluding the axes handled by WCS.
shape_wcs (dict[str, int]) – The shape of the axes handled by WCS.
axis_time (str) – The logical axis corresponding to changes in time.
axis_wavelength (str) – The logical axis corresponding to changes in wavelength.
axis_detector_x (str) – The logical axis corresponding to changes in detector \(x\)-coordinate.
axis_detector_y (str) – The logical axis corresponding to changes in detector \(y\)-coordinate.
- Return type:
- classmethod from_fits(path, window='Si IV 1394', axis_time='time', axis_wavelength='wavelength', axis_detector_x='detector_x', axis_detector_y='detector_y')[source]#
Given a single FITS file or an array of FITS files with the same OBSID, construct a SpectrographObservation object.
- Parameters:
path (Path | ScalarArray[Path]) – A single FITS file or an array of FITS files to load.
window (str) – The spectral window to load.
axis_time (str) – The logical axis corresponding to changes in time.
axis_wavelength (str) – The logical axis corresponding to changes in wavelength.
axis_detector_x (str) – The logical axis corresponding to changes in detector \(x\)-coordinate.
axis_detector_y (str) – The logical axis corresponding to changes in detector \(y\)-coordinate.
- Return type:
- classmethod from_scalar_array(a, like=None)#
Constructs a new version of this array using
aas the underlying data.- Parameters:
a (float | Quantity | AbstractScalarArray) – Anything that can be coerced into an instance of
named_arrays.AbstractScalarArray.like (None | Self) – Optional reference object. If provided, the result will be defined by this object.
- Return type:
- classmethod from_time_range(time_start=None, time_stop=None, description='', obs_id=None, window='Si IV 1394', axis_time='time', axis_wavelength='wavelength', axis_detector_x='detector_x', axis_detector_y='detector_y', limit=200, nrt=False, num_retry=5)[source]#
Given an OBSID and a time range, automatically download the data and construct an instance of
SpectrographObservation.- Parameters:
time_start (None | Time) – The start time of the search period. If
None, the start of operations, 2013-07-20 will be used.time_stop (None | Time) – The end time of the search period. If
None, the current time will be used.description (str) – The description of the observation. If an empty string, observations with any description will be returned.
obs_id (None | int) – The OBSID of the observation, a number which describes the size, cadence, etc. of the observation. If
None, all OBSIDs will be used.window (str) – The spectral window to load.
axis_time (str) – The logical axis corresponding to changes in time.
axis_wavelength (str) – The logical axis corresponding to changes in wavelength.
axis_detector_x (str) – The logical axis corresponding to changes in detector \(x\)-coordinate.
axis_detector_y (str) – The logical axis corresponding to changes in detector \(y\)-coordinate.
limit (int) – The maximum number of observations returned by the query. Note that this is not the same as the number of files since there are several files per observation.
nrt (bool) – Whether to return results with near-real-time (NRT) data.
num_retry (int) – The number of times to try to connect to the server.
- Return type:
- add_axes(axes)#
Add new singleton axes to this array.
- Parameters:
axes (str | Sequence[str]) – Either a single axis name or a sequence of axis names add to this array.
- Return type:
See also
named_arrays.add_axes()A functional version of this method.
- all(axis=None, where=<no value>)#
Return
Trueif all of the elements along the given axes areTrue.- Parameters:
- Return type:
See also
numpy.all()A functional version of this method.
- any(axis=None, where=<no value>)#
Return
Trueif any of the elements along the given axes areTrue.- Parameters:
- Return type:
See also
numpy.any()A functional version of this method.
- astype(dtype, order='K', casting='unsafe', subok=True, copy=True)#
Copy of the array cast to a specific data type.
Equivalent to
numpy.ndarray.astype().
- broadcast_to(shape, append=False)#
A new view of this array with the specified shape.
- Parameters:
- Return type:
See also
named_arrays.broadcast_to()A functional version of this method.
- cell_centers(axis=None, random=False)#
Convert an array from cell vertices to cell centers.
- Parameters:
- Return type:
- combine_axes(axes=None, axis_new=None)#
Combine some of the axes of the array into a single new axis.
- index(value, axis=None)#
- index_secant(value, axis=None)#
- integrate(axis, component=None)#
Integrate the outputs over the given input
axisor axes.The differential measure is computed from the inputs via
AbstractArray.volume_cell():If
componentisNone, the whole input is used as the integration variable andlen(axis)must match the dimensionality of the inputs (one for a scalar, two for aCartesian2dVectorArray, etc.).If
componentis astr, that named sub-element of the inputs (a scalar or a sub-vector) supplies the measure, andlen(axis)must match its dimensionality.
A vertex axis (where the inputs represent bin edges) is integrated with a Riemann sum, while a center axis (where the inputs represent samples) is integrated with the trapezoidal rule; mixing the two in a single call is supported. The integrated axes are removed from the outputs and collapsed in the inputs by averaging.
- Parameters:
- Return type:
Examples
Integrate a constant function over a 1D domain.
import numpy as np
import astropy.units as u
import named_arrays as na

f = na.FunctionArray(
    inputs=na.ScalarLinearSpace(0, 2, axis="x", num=101) * u.nm,
    outputs=na.ScalarArray(np.full(101, 3.0), axes=("x",)) * u.ph,
)

f.integrate("x")
FunctionArray(
    inputs=ScalarArray(
        ndarray=1. nm,
        axes=(),
    ),
    outputs=ScalarArray(
        ndarray=6. nm ph,
        axes=(),
    ),
)
- interp_linear(item)#
Linearly interpolate this array to find its value at the given fractional index.
- Parameters:
item (dict[str, AbstractArray]) – A fractional index at which to evaluate the array.
- Return type:
- isel(**item)#
Index this array along named axes given as keyword arguments.
This is a convenience wrapper around
__getitem__():a.isel(x=0)is equivalent toa[dict(x=0)].Since keyword-argument names must be valid Python identifiers, axes whose names are not valid identifiers can only be indexed using the
dictform,a[{...}].- Parameters:
item (int | slice | AbstractArray) – The index to apply along each named axis.
self (Self)
- Return type:
- max(axis=None, initial=<no value>, where=<no value>)#
The maximum value of this array along the given axes.
- Parameters:
axis (None | str | Sequence[str]) – The logical axis or axes along which the operation is computed.
initial (_Buffer | _SupportsArray[dtype[Any]] | _NestedSequence[_SupportsArray[dtype[Any]]] | complex | bytes | str | _NestedSequence[complex | bytes | str]) – The initial value of the minimum, required if where provided.
where (Self) – An optional mask which selects which elements to be considered.
self (Self)
- Return type:
See also
numpy.max()A functional version of this method.
- mean(axis=None, where=<no value>)#
The mean value of this array along the given axes.
- Parameters:
- Return type:
See also
numpy.mean()A functional version of this method.
- median(axis=None)#
The median value of this array along the given axes.
- Parameters:
axis (None | str | Sequence[str]) – The logical axis or axes along which the operation is computed.
See also
numpy.median()A functional version of this method.
- min(axis=None, initial=<no value>, where=<no value>)#
The minimum value of this array along the given axes.
- Parameters:
axis (None | str | Sequence[str]) – The logical axis or axes along which the operation is computed.
initial (_Buffer | _SupportsArray[dtype[Any]] | _NestedSequence[_SupportsArray[dtype[Any]]] | complex | bytes | str | _NestedSequence[complex | bytes | str]) – The initial value of the minimum, required if where provided.
where (Self) – An optional mask which selects which elements to be considered.
self (Self)
- Return type:
See also
numpy.min()A functional version of this method.
- ndindex(axis_ignored=None)#
An iterator that yields the index of each element of this array.
- Parameters:
- Return type:
See also
named_arrays.ndindex()A functional version of this method.
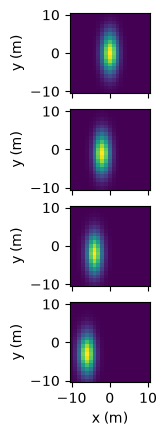
- pcolormesh(axs, input_component_x, input_component_y, input_component_row=None, input_component_column=None, index=None, output_component_color=None, **kwargs)#
Plot a
FunctionArrayviamatplotlib.pyplot.pcolormesh().FunctionArray.pcolormesh()takes in an axes object, or array of axes objects, along with components to be plotted along the x and y plot axes (input_component_xandinput_component_y). Additional components can be tiled along subplot row/column and are specified ininput_component_rowandinput_component_column.import named_arrays as na import numpy as np import astropy.units as u import matplotlib.pyplot as plt position = na.Cartesian2dVectorLinearSpace( start=-10, stop=10, axis=na.Cartesian2dVectorArray( x='position_x', y='position_y', ), num=21, ) * u.m x_width = 5 * u.m y_width = 2 * u.m velocity = 1 * u.m/u.s time = na.ScalarLinearSpace( start=0 * u.s, stop=3 * u.s, num=4, axis='time' ) intensity = np.exp(-(((position.x + velocity*time)/x_width) ** 2 + ((position.y + 2*velocity*time)/y_width)** 2)) scene = na.FunctionArray( inputs=position, outputs=intensity, ) fig, axs = plt.subplots( nrows=scene.outputs.shape['time'], squeeze=False, sharex=True, subplot_kw=dict(aspect='equal'), ) scene.pcolormesh( axs=axs, input_component_x='x', input_component_y='y', input_component_row='time', )
- percentile(q, axis=None, out=None, overwrite_input=False, method='linear', keepdims=False)#
The requested percentile of this array along the given axes.
- Parameters:
q (int | float | Quantity | Self) – The percentile to compute.
axis (None | str | Sequence[str]) – The logical axis or axes along which the operation is computed.
out (None | Self) – An optional output array in which to place the result.
overwrite_input (bool) – Whether to overwrite the input array.
method (str) – How to interpolate the result.
keepdims (bool) – A boolean flag indicating whether to keep the reduced dimensions.
self (Self)
See also
numpy.percentile()A functional version of this method.
- ptp(axis=None)#
The peak-to-peak value of this array along the given axes.
- Parameters:
- Return type:
See also
numpy.ptp()A functional version of this method.
- regrid(inputs, axis=None, method='multilinear', weights=None)#
Resample this function array onto a new set of input coordinates using
named_arrays.regridding.regrid().- Parameters:
inputs (AbstractArray) – The new input coordinates on which to resample the outputs.
axis (None | str | tuple[str]) – The logical axes of the input over which to resample.
method (Literal['multilinear', 'conservative']) – The resampling method to use.
weights (None | tuple[AbstractScalar, dict[str, int], dict[str, int]]) – Optional weights which can be computed in advance using
weights()to greatly speed repeated resampling of the same inputs.
- Return type:
See also
weights()If you need to resample the same coordinates more than once.
- replace(**changes)#
A method version of
dataclasses.replace()for named arrays.- Parameters:
changes – The fields of the dataclass to be overwritten
- Return type:
- reshape(shape)#
Reorganize this array into a new shape.
- rms(axis=None, where=<no value>)#
The root-mean-square of this array along the given axes.
- show(index_time=0, ax=None, cax=None, norm=None, vmin=None, vmax=None, velocity_min=<Quantity -100. km / s>, velocity_max=<Quantity 100. km / s>, cbar_fraction=0.1)[source]#
Display a single raster of this dataset as a false-color image.
- Parameters:
index_time (int) – The index along the time axis to show.
ax (Axes) – The
matplotlibaxes on which to plot the image. IfNone, a new figure is created.cax (Axes) – The axes on which to plot the colorbar. If
None, space is stolen from ax to create a new set of axes.norm (None | Callable) – The normalization method used to scale data into the range [0, 1] before mapping to colors.
vmin (None | float | Quantity | AbstractScalar) – The minimum value of the data range. If norm is
None, this parameter will be ignored.vmax (None | float | Quantity | AbstractScalar) – The maximum value of the data range. If norm is
None, this parameter will be ignored.velocity_min (Quantity) – The minimum Doppler velocity of the data range.
velocity_max (Quantity) – The maximum Doppler velocity of the data range.
cbar_fraction (float) – The fraction of the space to use for the colorbar axes if cax is
None.
- Return type:
- std(axis=None, where=<no value>)#
The standard deviation of this array along the given axes.
- Parameters:
- Return type:
See also
numpy.std()A functional version of this method.
- sum(axis=None, where=<no value>)#
The sum of each element of this array along the given axes.
- Parameters:
- Return type:
See also
numpy.sum()A functional version of this method.
- take_along_axis(indices, axis)#
Take values from this array by matching
indicesalongaxis.- Parameters:
indices (AbstractArray) – The integer indices to take along
axis.axis (str) – The axis of this array along which the values are taken.
self (Self)
- Return type:
See also
named_arrays.take_along_axis()A functional version of this method.
- to(unit, equivalencies=[], copy=True)#
Convert this array to a new unit.
Equivalent to
astropy.units.Quantity.to().
- to_jshtml(norm=None, vmin=None, vmax=None, velocity_min=<Quantity -100. km / s>, velocity_max=<Quantity 100. km / s>, cbar_fraction=0.1, fps=None)[source]#
Create a Javascript animation of this observation.
- Parameters:
norm (None | str | Normalize) – The normalization method used to scale data into the range [0, 1] before mapping to colors.
vmin (None | int | float | complex | ndarray | Quantity | AbstractArray) – The minimum value of the data range. If norm is
None, this parameter will be ignored.vmax (None | int | float | complex | ndarray | Quantity | AbstractArray) – The maximum value of the data range. If norm is
None, this parameter will be ignored.velocity_min (Quantity) – The minimum Doppler velocity of the data range.
velocity_max (Quantity) – The maximum Doppler velocity of the data range.
cbar_fraction (float) – The fraction of the space to use for the colorbar axes.
fps (None | float) – The frames per second of the animation.
- Return type:
- to_string(prefix=None, multiline=None)#
Convert this array instance to a string representation.
- to_string_array(format_value='%.2f', format_unit='latex_inline', pad_unit='$\\,$')#
Convert to an array of strings where each string has an appropriately-formatted unit attached to the value.
- to_value(unit, equivalencies=[])#
The numerical value of this array, possibly in a different unit.
Equivalent to
astropy.units.Quantity.to_value().
- transpose(axes=None)#
Reorder the axes of this array to the given sequence.
- Parameters:
- Return type:
See also
numpy.transpose()The
numpyversion of this method.
- var(axis=None, where=<no value>)#
The variance of this array along the given axes.
- Parameters:
- Return type:
See also
numpy.var()A functional version of this method.
- vmr(axis=None, where=<no value>)#
The variance-to-mean ratio of this array along the given axes.
- volume_cell(axis)#
Computes the n-dimensional volume of each cell formed by interpreting this array as a logically-rectangular grid of vertices.
Note that this method is usually only used for sorted arrays.
If self is a scalar, this method computes the length of each edge, and is equivalent to
numpy.diff(). If self is a 2d vector, this method computes the area of each quadrilateral, and if self is a 3d vector, this method computes the volume of each cuboid.
- weights(inputs, axis=None, method='multilinear')#
Compute the resampling weights of this array using
named_arrays.regridding.weights(). The output of this method is designed to be used byregrid().- Parameters:
inputs (AbstractArray) – The new input coordinates on which to resample the outputs.
axis (None | str | tuple[str]) – The logical axes of the input over which to resample.
method (Literal['multilinear', 'conservative']) – The resampling method to use.
- Return type:
See also
regrid()A method designed to use these weights.
- property axes: tuple[str, ...]#
A
tupleofstrrepresenting the names of each dimension of this array.Must have the same length as the number of dimensions of this array.
- property axes_center: tuple(str)#
Return keys corresponding to all input axes representing bin centers
- property axes_flattened: str#
Combine
axesinto a singlestr.This is useful for functions like
numpy.flatten()which returns an array with only one dimension.
- property axes_vertex: tuple(str)#
Return keys corresponding to all input axes representing bin vertices
- axis_detector_x: str = 'detector_x'#
The logical axis corresponding to changes in detector \(x\)-coordinate.
- axis_detector_y: str = 'detector_y'#
The logical axis corresponding to changes in detector \(y\)-coordinate.
- property broadcasted: FunctionArray#
if this array has multiple components, broadcast them against each other.
Equivalent to
a.broadcast_to(a.shape).
- property explicit: FunctionArray#
Converts this array to an instance of
named_arrays.AbstractExplicitArray.
- property indices: dict[str, ScalarArrayRange]#
Compute the index of each element of this array.
See also
named_arrays.indices()A functional version of this method.
- inputs: InputsT = 0#
The inputs of the function.
- property length: FunctionArray#
L2-norm of this array.
- property ndim: int#
Number of dimensions of the array. Equivalent to
numpy.ndarray.ndim.
- outputs: OutputsT = 0#
The outputs of the function.
- property radiance: Self#
Convert to radiometric units using
iris.sg.effective_area().
- property shape: dict[str, int]#
The number of elements along each axis of the array. Analogous to
numpy.ndarray.shapebut represented as adictwhere the keys are the axis names and the values are the axis sizes.
- property size: int#
Total number of elements in the array. Equivalent to
numpy.ndarray.size
- timedelta: Quantity | AbstractScalar = <Quantity 0. s>#
The exposure time for each frame in the observation.
- property type_abstract: Type[AbstractFunctionArray]#
The
named_arrays.AbstractArraytype corresponding to this array.
- property type_explicit: Type[FunctionArray]#
The
named_arrays.AbstractExplicitArraytype corresponding to this array.
- property value: FunctionArray#
Returns a new array with its units removed, if they exist.